

How to Calculate Instagram Engagement Rate: Formulas, Examples and a Free Calculator
Engagement measures how many people react to what you post, but there isn't one single formula. Here are the three most common ones, when each makes sense, what 2026 benchmarks look like and a free calculator.

If you've ever wondered whether 200 likes is a lot or a little, the answer depends on how many followers you have. That's why engagement rate exists: a percentage that lets you compare posts and accounts of different sizes.
The problem is that nobody agrees on how to calculate it. And that matters, because two figures calculated with different formulas can't be compared.
The three most common formulas
| Formula | How it's calculated | Who uses it |
|---|---|---|
| By followers, full | (likes + comments + saves + sends) ÷ followers × 100 | Buffer [2] |
| By followers, simple | (likes + comments) ÷ followers × 100 | Socialinsider [1] |
| By reach | (likes + comments + saves + sends) ÷ reach × 100 | Practical option if you have the reach figure |
Rival IQ, in its benchmark report, also calculates engagement by dividing all interactions by total followers [3]. It's a common approach because the follower count is always visible, while the reach of each post is only visible to whoever manages the account.
Pick one formula and always use it. If you compare your number with a benchmark, check that the benchmark uses the same formula.
A step-by-step example
· By followers, full: (20 + 2 + 4 + 3) ÷ 5,000 = 0.58%
· By followers, simple: (20 + 2) ÷ 5,000 = 0.44%
· By reach: 29 ÷ 1,500 = 1.93%
Notice that the same Reel gives three different figures. None of them is "the real one": they measure different things. What matters is to follow the same formula post after post to see whether you're improving.

Benchmarks in 2026
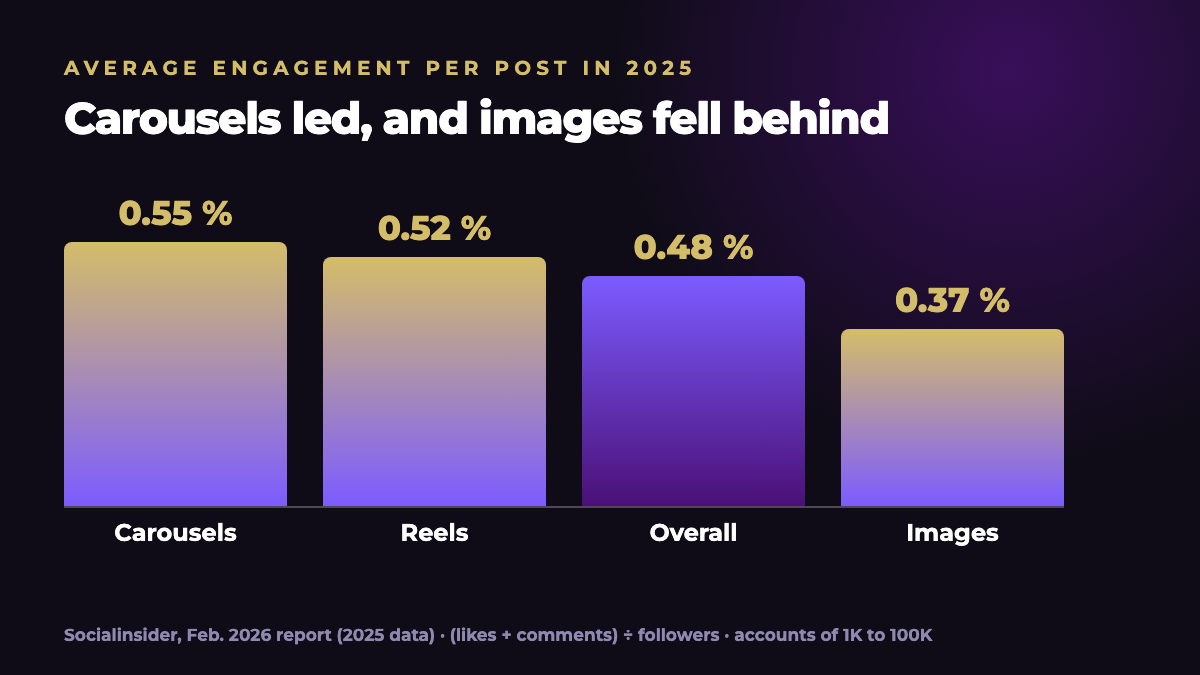
Socialinsider analyzed more than 67 million posts from about 579,000 business accounts with between 1,000 and 100,000 followers. Using its simple formula (likes + comments divided by followers), the 2025 averages were [1]:
- Carousels: 0.55%
- Reels: 0.52%
- Images: 0.37%
- Overall average: 0.48%, roughly 24% lower than the previous year.
Rival IQ reached a similar conclusion about formats: in its 2025 report, carousels outperformed Reels across all industries combined, although in some (fashion, home decor, retail and travel) Reels won [3].
They're averages for business accounts of a specific size, not a target. If you have fewer than 1,000 followers, more than 100,000 or a very specific audience, your real point of comparison is your own previous posts.
How to improve your engagement rate
- Start with a strong hook. If you don't stop the scroll, there's no way to get interaction. You have 12 hook formulas to test.
- Ask for one action. Save, comment or send to someone: one at a time.
- Reply to comments. It's the most direct way to turn a reaction into a conversation.
- Post when your audience responds. Here's how to find your best times to post.
- Learn from your best posts. Repeat the format and topic that work, not the post itself.
Use it to vet an influencer, carefully
If you're going to pay for a collaboration, calculating the engagement rate of a candidate's last 10 pieces of content gives you a clue about whether their audience reacts. But one number doesn't tell the whole story: also check whether the comments are real and specific, whether the audience fits your brand and what their reputation is. All of that is in the guide on how to choose an influencer for your brand.
I put together a spreadsheet with three tabs: a calculator for a single post, another for several posts with an average for your account, and another to compare collaboration candidates. It comes with sample data (made up) and the formulas explained.
How Viral Influencer helps
Viral Influencer compares your candidates with your brand and gives you a synergy score, red flags with sources and an estimated cost, so engagement is one criterion and not the only one. If you want to know how much a collaboration could cost, also see how much influencers charge for advertising.
Frequently asked questions
What is engagement rate on Instagram?
It's the percentage you get by dividing a post's interactions (likes, comments and, depending on the formula, saves and sends) by the number of followers or by reach. It lets you compare posts and accounts of different sizes.
What is a good engagement rate on Instagram?
It depends on the formula and the size of the account. In Socialinsider's 2026 report, the 2025 average was 0.48% per post (likes and comments divided by followers), for business accounts with 1,000 to 100,000 followers. Compare yourself with accounts similar to yours, not with a magic number.
Is it better to calculate engagement rate by followers or by reach?
They answer different questions. By followers tells you what share of your community reacts; by reach tells you how appealing the post was to the people who saw it. Don't mix figures calculated with different formulas.
Do Instagram Stories count toward engagement rate?
This guide and its calculator focus on posts and Reels. Stories have their own metrics (replies, taps, exits) and are best measured separately.
Can I use engagement rate to choose an influencer?
It's a useful clue, not proof. High engagement with generic comments isn't worth the same as engagement with real conversations. Use it together with audience fit and reputation.
Sources
Data and quotes checked against the original pages in October 2026. If a figure is old or comes from a single company's data, we say so in the text.
- Socialinsider. “2026 Instagram Organic Benchmarks”. February 20, 2026 (2025 averages). socialinsider.io ↗
- Buffer. “Best Time to Post on Instagram in 2026: New Data from 9.6 Million Posts”. September 2026. buffer.com ↗
- Rival IQ. “2025 Social Media Industry Benchmark Report”. February 25, 2025. rivaliq.com ↗